How have we used R to improve demographic experience monitoring? This is the second of our case study series, showcasing some of the ways we have been using R here at Barnett Waddingham.
Too often, we find the tendency is to “make do and mend” rather than make the effort to reassess whether existing tools remain fit for purpose. Giving these areas some focus can lead to large easy wins for improving efficiency and the quality of analysis carried out.
One example of such a process is demographic experience analyses. Many firms are using process and tools for this fundamental task that were developed more than 20 year ago. As such, they are missing out on the benefits that newer alternative approaches can bring.
This case study shows how we have used R to improve demographic experience analyses that we carry out on our outsourced Chief Actuary roles and on our Reviewing Actuary roles.
How did the previous process work?
Historically we carried out our experience analysis using Excel. The process had a number of steps, which took time to run, especially for large data sets. Limitations of Excel also led to manual interventions which increased the level of checking required before we could rely on results. The analysis adequately produced the core information required. However, additional work would be required if we needed to measure experience by a different risk factor, or over different time periods.
Why did we review our experience analyses?
We had started to embrace different technologies and programming languages and realised that significant improvements could be made by replatforming our experience analysis to R. We knew that by changing approach, rather than just “making do”, we would not only be able to reduce the time we spent on carrying out handle-turning aspects of the process, but that we could also increase the flexibility of the analysis and improve the presentation. Overall, this would provide more valuable insights for our clients in an efficient way.
How did we improve our experience investigations?
Improvements were carried out in four steps.
- We transposed the existing experience investigation process from Excel into R, and ensured the R process could replicate Excel results.
- We went through an iterative process of reviewing the analysis carried out, and the outputs produced so that information produced was informative for decision making, but not burdensome or overwhelming.
- We built an interactive dashboard around the analysis to visualise results, allowing the user to change parameters and see the results almost instantaneously.
- We automated the process.
What analysis is carried out now?
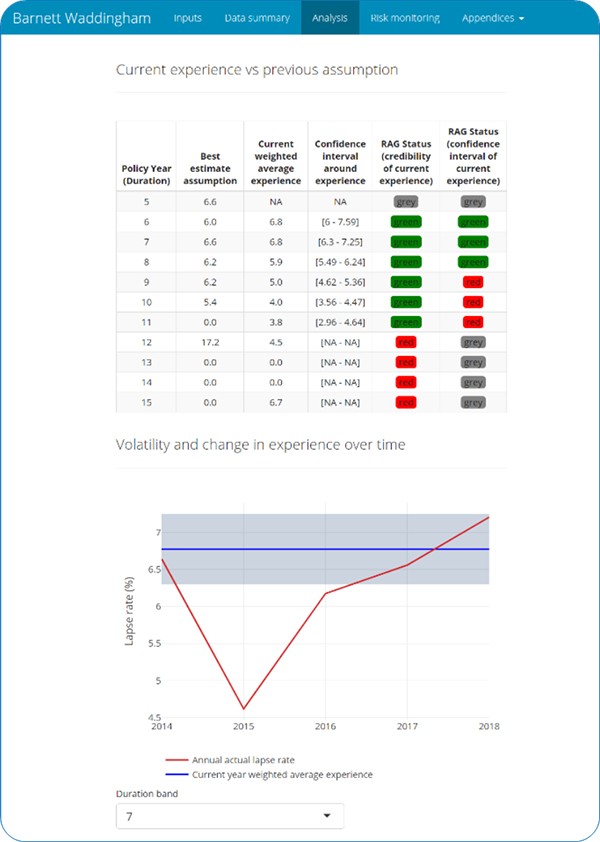
The tools produce tables showing experience compared to the most recent (or proposed) best estimate assumptions. RAG statuses based on statistical tests quickly show us where focus is needed in the assumption setting process.
Graphs indicate trends in experience over time.
The flexible interface allows us to easily:
- “Slice and dice” the analysis by factors like product type and distribution channel
- Adjust the weighting given to past experience – for example we can exclude anomalous experience if our view is that it does not reflect longer term trends (e.g. Covid-19)
- Adjust the confidence levels on statistical tests used
When we are satisfied with the analysis, the tools generate static reports, which can be passed to reviewers and auditors. The reports contain:
- Charts and tables, which can be copied into assumption reports
- All information required to reproduce the analysis and results
How has this helped us?
We have rolled this tool out on all of our life insurance clients where we carry out the Chief Actuary or Reviewing Actuary roles.
As well as making it significantly more efficient to carry out work, a primary benefit in itself in terms of reduced cost and freeing-up resources, the tool has already delivered the following tangible benefits.
- Enabled weekly experience monitoring during the height of Covid-19, with minimal burden.
- Can easily and quickly identify variations and outliers in experience by different risk factors, such as where the persistency experience of business sold by a particular broker is materially worse than others.
- Identified an error in the experience investigation carried out by the Actuarial Function on one of our Reviewing Actuary clients.
- Links into our risk management and risk reporting tools to provide regular risk management information.
Can we help you?
We want others to reap the benefits of our cost-effective automated experience analysis tools.
If you or your team could benefit from an efficient and automated experience analysis process, please contact Amit Lad who will be happy to provide additional information and arrange a demonstration.

Applications of R in insurance: capital modelling
Read our case study to understand how R can be used as both a parameterisation tool and as a component of the internal model.
Find out more
Applications of R in insurance: Tripartite Template asset data
See how we have used R to improve how we process Tripartite Template (TPT) asset data.
Find out more