How have we used R in capital modelling work?
Every now and again there comes a tool which improves productivity by leaps and bounds, a tool that becomes invaluable to the actuary’s toolkit. Excel was such a tool, although it is now largely accepted that it is not a robust tool for enterprise-level applications.
The UK 2020 NHS Test and Trace error shows how the limitations of Excel are not well understood when it comes to critical and manual processes, which can give rise to erroneous conclusions.
R is another such invaluable tool and some will have you believe a tool that will replace Excel. It is such a powerful and versatile tool that, increasingly, my team cannot do without it. This case study is the start of a series in which we will be showcasing some of the ways that we have been using R here at Barnett Waddingham for our clients.
We begin our series by showing how we have used R in capital modelling work.
Actuaries have used R in capital modelling as a parameterisation tool for a number of years with the actual internal model based on another platform. The case study below, however, shows how R can be used as both a parameterisation tool and as a component of the internal model.
What was the problem?
The client used Excel to model a bespoke and non-standard risk component of their internal model. The model run time was slow and there were also a number of issues with the model methodology that required remediation.
Why was the client/user frustrated?
The client team responsible for the model was unhappy. The Excel model could only be open on a super computer due to its size. There was only one such computer available that created a single point of failure for the model. This frustrated the team as they did not have sufficient access to the model to make the necessary changes.
Despite the super computer, the run time was measured in hours. This slowed down the overall internal model run time. The client also needed the model methodology issues rectified in order to pass validation but were struggling to remediate it by themselves due to resource constraints and changes in personnel.
What did we do to solve the problem?
We replicated the results of the Excel model in R in two days, which reduced the runtime to a matter of seconds. We then worked with the client’s capital modelling team to redesign the model to better reflect the underlying risk. This included proposing and implementing the new methodology.
At each stage, we proposed the changes and took it through the client’s governance team. This included why R was the best platform to undertake the work in compared to the alternatives available.
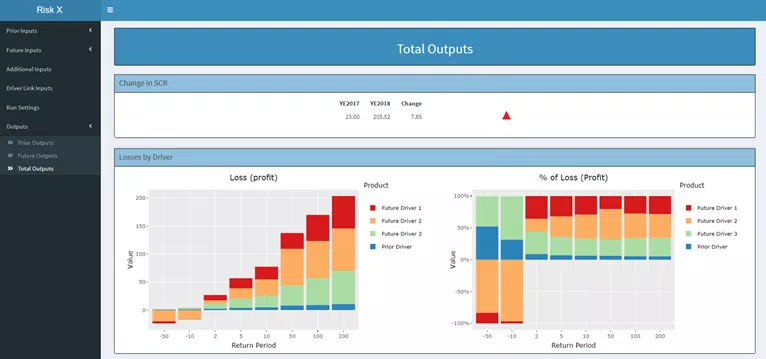
In addition, workshops were ran with the Subject Matter Experts (SMEs) to calibrate the model. Given the high degree of judgement, we needed a model that was interactive and could be run in real-time so that SMEs can see the impact of their judgements during the workshops. R Shiny gave us a perfect way of doing this.
The model was documented and tests ran so that the client can continue maintaining the model once we had handed it over.
What was the outcome?
The methodology was more robust, which meant that it eventually passed validation. The model has now been submitted as part of the client’s internal model approval process (IMAP).
The model run time improved and more people are now able to access the model.
The SMEs were also more engaged in the calibration process, often asking questions before we prompted them based on the visuals presented to them. This helped senior management understand the model better and in a transparent way.
A handover of the model to the client was implemented and they have been able to make further enhancements to the model by themselves
Can we help you?
If you think your team could benefit from this experience, please contact Wan Heah or Alpesh Patel who will be happy to help.

Applications of R in insurance: demographic experience monitoring
How we have used R to improve demographic experience monitoring?
Read our case study
Applications of R in insurance: Tripartite Template asset data
Understand how we have used R to improve how we process Tripartite Template (TPT) asset data
Find out more